

It is hard to make out in the picture given the dimming light, but the water level is about 37cm below the bottom of the overflow pipe.
You can compare this to my post showing the water level back in December. Around December 18, the water level was almost even with the bottom of the overflow pipe:
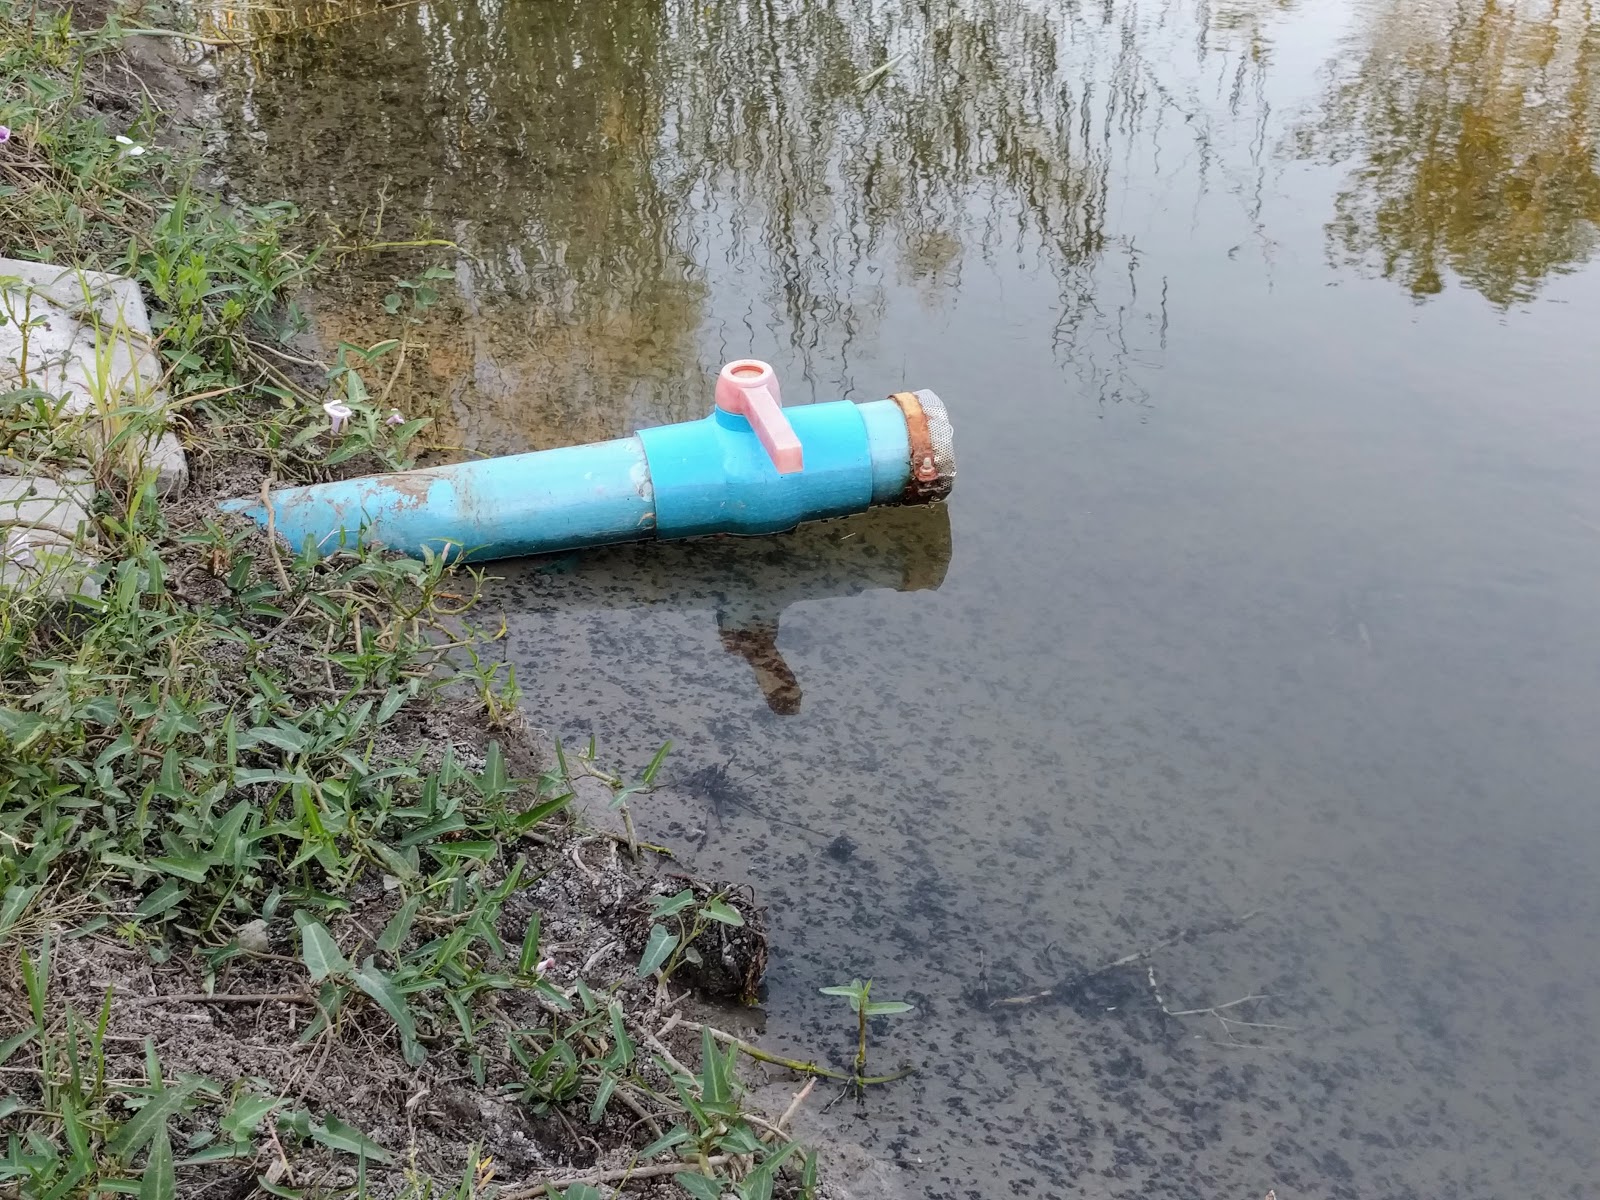
This is a 37cm drop in about 76 days, or just under 5mm of water loss average per day. A quick internet search to see how this compares to any standard numbers out there turned up this FAO PDF on “evapotranspiration”. If you look at example 1 in chapter 1, you see a calculation of 4.9mm/day evaporation on a hypothetical lake. Well, 370mm/76days comes out to 4.87mm/day. I’m sure the similarity in these numbers is mostly coincidence, but it confirms that the numbers I am seeing are reasonable. So I can reasonably expect about 5mm evaporation per day.
Now there may also be some effect of water moving through the soil to and from the nearby canal, so this number is meant to be taken with a grain of salt. But, while the water level is a little low in the pond, exposing the very top of one of the retaining walls in the bioregeneration zone and exposing some of the sand, if the rains that are starting to come now can hold the level here until the real rainfall which normally kicks in about a month from now, then we should be fine.
But for now, the sand in the biofiltration zone of the pond is starting to get exposed. And more and more is exposed every day:
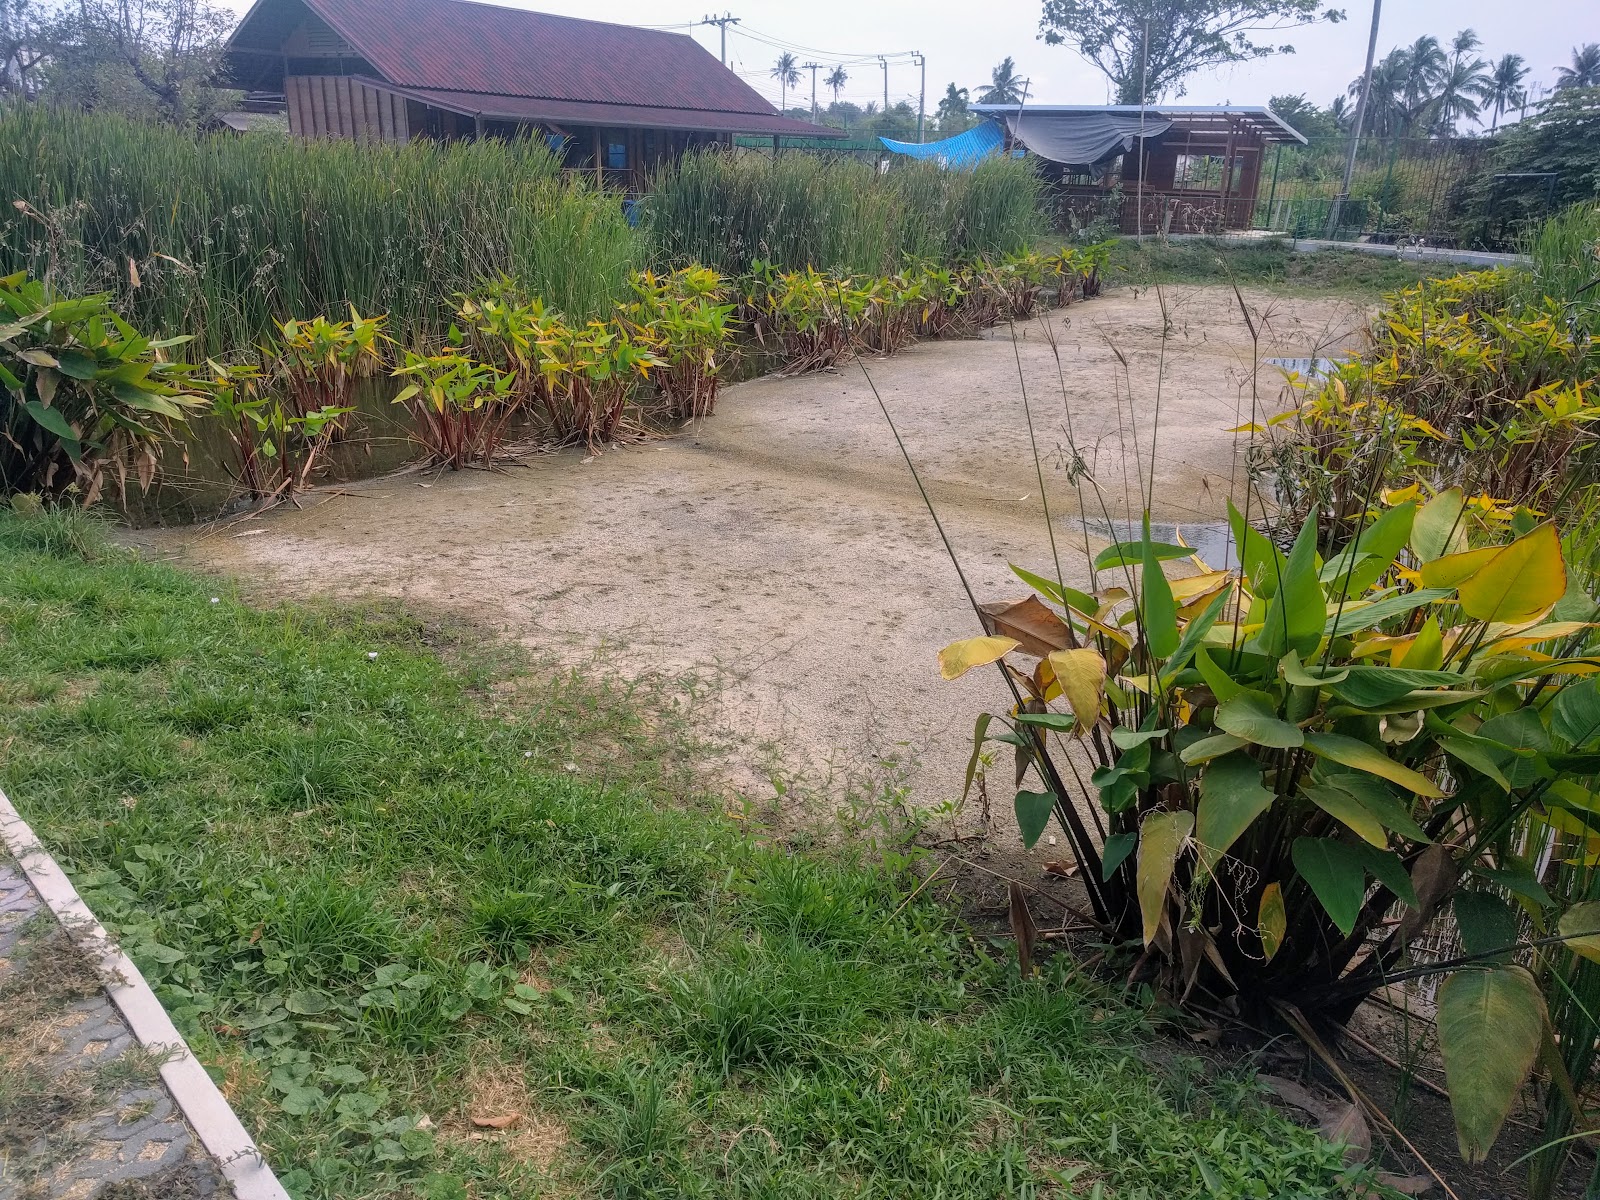
This whole area was under water a few months ago. Hmmm.